
Starting mortality: what is normal, what is not, and when to call
In every flock, a few chicks die in the first days: the journey, a chick weaker than the others, a start that was one hour late. That is not a failure, it is the trade. The failure is not knowing from which figure it is no longer normal, and waiting one more day 'to see'. This lesson gives you the normal curve of the first 30 days for the three types of chick, the method for reading each death (when, where, which, how), the signs that require the veterinarian of your area, and the rule that saves flocks: today's signal is called in today.
14 min read · 5-question quiz at the end
 By Abdul Hussein ChoumanFounder of NEXTEKCI · Agnibilékrou hatchery since 2006
This lesson is part of The day-old chick: the first 30 days specialisation. It opens to every registered student, from free registration. Levels 1 to 5 and the tracks remain readable by everyone.
In every flock, a few chicks die in the first days: the journey, a chick weaker than the others, a start that was one hour late. That is not a failure, it is the trade. The failure is not knowing from which figure it is no longer normal, and waiting one more day 'to see'. This lesson gives you the normal curve of the first 30 days for the three types of chick, the method for reading each death (when, where, which, how), the signs that require the veterinarian of your area, and the rule that saves flocks: today's signal is called in today.
- ✓Calculate the mortality and the viability of a flock on the number received, day by day and cumulatively, and compare them with the normal 30-day curve
- ✓Recognise abnormal mortality by its figure, its date, its zone and the position of the dead
- ✓Tell a management cause (cold, heat, water, feed, piling up) from a health sign that requires the veterinarian of the area
- ✓Call at the right time with the right information, and handle dead and culled chicks properly
- Four words to count correctly
- The normal curve of the first 30 days
- Two worked calculations: the normal flock and the flock that alerts
- Reading a death: when, where, which, how
- Health signs: describe, do not treat
- When to call, whom to call, what to send
- Handling the dead and the culls, every day
- Going further
- •Everything is calculated on the starting count (live chicks counted when the boxes are opened); dead and culls on two separate lines; viability = 100% − dead − culls.
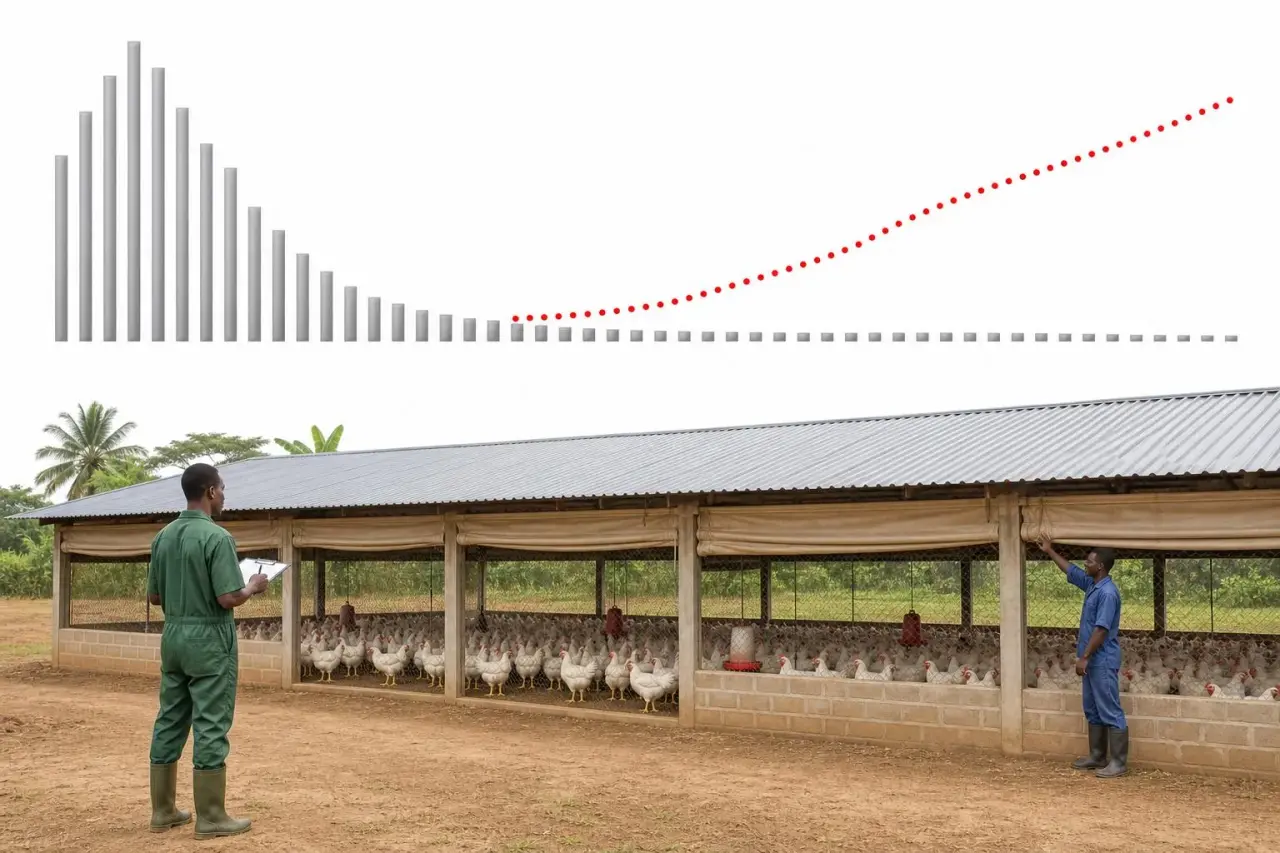
- •Normal curve for the white broiler: peak on days 2 to 4, ≈ 1% at 7 days (tolerable 1.5%), 0.2 to 0.5% per week afterwards, 2 to 3% at 30 days; coloured chicken 1.5 to 2.5%; brown layer 1 to 2%.
- •Abnormal: more than 1% in one day after day 1, more than 2% at 7 days, mortality rising again after day 7, dead grouped in one zone, water intake falling.
- •Read each death with four questions (when, where, which, how): a management cause is corrected within the hour and mortality stops; otherwise it is a health sign to describe to the veterinarian of the area, never to treat yourself.
- •Today's signal is called in today: veterinarian of the area for health signs, NEXTEKCI adviser (+225 05 44 83 27 79) for management, with the complete record, photos and a short video.
© NEXTEKCI, Agnibilékrou · Lessons protected by copyright · Terms of use · Privacy policy